
How to Find Where Readers Drop Off Your PDF
“Average completion: 66%” sounds like a verdict on the whole document. It almost never is. Most PDFs don't lose readers evenly — they lose them at one page: the dense methodology spread, the wall-of-text terms section, the pricing table that needed a warm-up it didn't get.
Page-level reading data finds that page. This tutorial pulls it from the sessions API and turns ten reading sessions into a funnel with the cliff marked — so you fix one spread instead of rewriting the whole report.
Track reading, not just opens
Per-page data needs the document behind tracking links — one per recipient, so every session carries a name:
curl -X POST https://apdf.io/api/docs/8432e-b4ebb-74433/links \
  -H "Authorization: Bearer YOUR_API_TOKEN" \
  -H "Accept: application/json" \
  -d name="Lucia Ferraro" \
  -d email="lucia@ferraro.example"
From then on the viewer records which pages each reader entered and how long they stayed — the raw material for everything below. (New here? The recipient analytics tutorial covers the setup end to end.)
Read one session's story first
Before aggregating, look at a single reader. In the dashboard, go to Documents → Analytics, open the document, switch to the Sessions tab and expand a session:
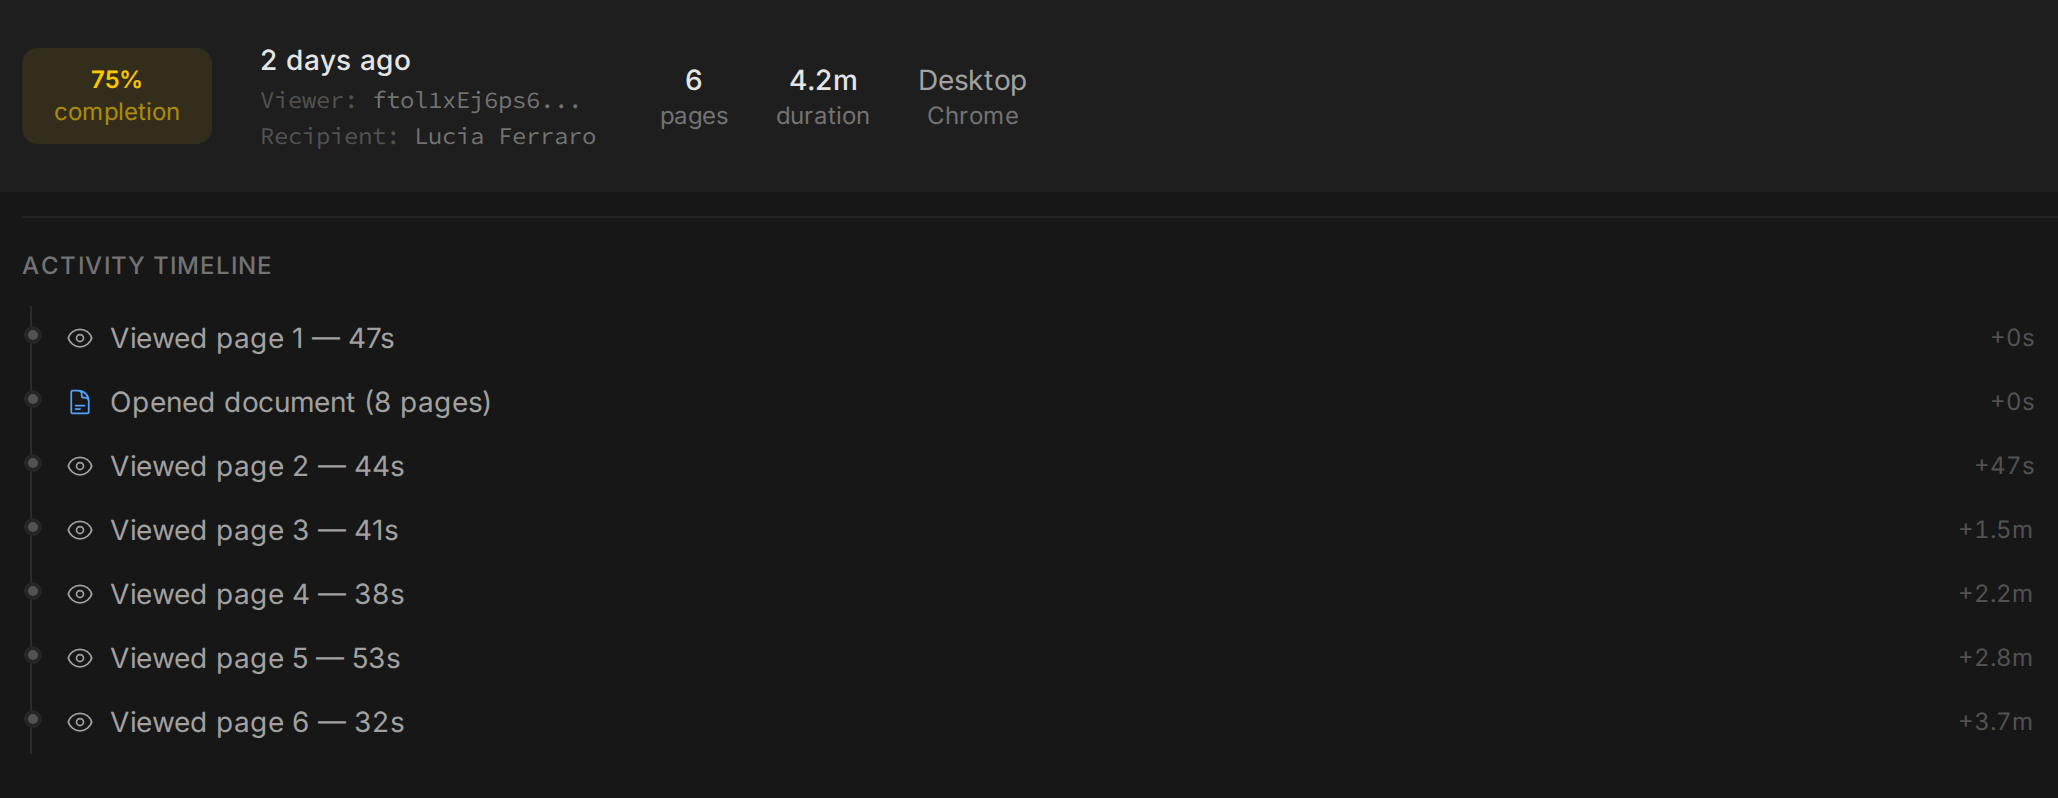
This reader tells the whole story in miniature: steady 38–47s per page, 53 seconds on page 5 (the case study — working), 32 seconds on page 6… and gone. The same data comes back over the API from the session detail endpoint:
GET /api/docs/8432e-b4ebb-74433/analytics/sessions/{sessionId}

{
    "metrics": {
        "total_duration_ms": 254500,
        "pages_viewed": 6,
        "total_pages": 8,
        "completion_pct": 75,
        "downloads": 0,
        "prints": 0
    },
    "pages": [
        { "page": 1, "views": 1, "duration_ms": 47000, "viewed": true },
        { "page": 2, "views": 1, "duration_ms": 44000, "viewed": true },
        { "page": 3, "views": 1, "duration_ms": 41000, "viewed": true },
        { "page": 4, "views": 1, "duration_ms": 38000, "viewed": true },
        { "page": 5, "views": 1, "duration_ms": 52500, "viewed": true },
        { "page": 6, "views": 1, "duration_ms": 32000, "viewed": true },
        { "page": 7, "views": 0, "duration_ms": 0, "viewed": false },
        { "page": 8, "views": 0, "duration_ms": 0, "viewed": false }
    ]
}
(The response also carries the session's recipient and full event timeline — the screenshot above is rendered from it.)
Build the funnel across all readers
One reader is an anecdote; the cliff shows up when you stack them. This script lists the sessions, pulls each one's per-page data, and prints how many readers each page kept — standard library only:
import json
import os
import time
import urllib.request

BASE = os.environ.get("BASE", "https://apdf.io")
DOC_ID = os.environ["DOC_ID"]
TOKEN = os.environ["API_TOKEN"]

def get(path):
    req = urllib.request.Request(f"{BASE}/api{path}", headers={
        "Authorization": f"Bearer {TOKEN}",
        "Accept": "application/json",
    })
    with urllib.request.urlopen(req) as res:
        return json.load(res)

sessions = get(f"/docs/{DOC_ID}/analytics/sessions?per_page=100")["data"]

reached = {}   # page -> sessions that viewed it
dwell = {}     # page -> total ms across sessions
total_pages = 0

for s in sessions:
    time.sleep(0.4)  # stay under the API's burst rate limit
    detail = get(f"/docs/{DOC_ID}/analytics/sessions/{s['session_id']}")["data"]
    total_pages = detail["metrics"]["total_pages"]
    for p in detail["pages"]:
        if p["viewed"]:
            reached[p["page"]] = reached.get(p["page"], 0) + 1
            dwell[p["page"]] = dwell.get(p["page"], 0) + p["duration_ms"]

n = len(sessions)
print(f"{n} sessions · {total_pages} pages\n")
print(f"{'page':>4}  {'reached':>7}  {'kept':>5}  {'avg dwell':>9}")

prev = n
for page in range(1, total_pages + 1):
    r = reached.get(page, 0)
    kept = f"{r / prev * 100:3.0f}%" if prev else "  —"
    avg = f"{dwell.get(page, 0) / r / 1000:5.0f}s" if r else "    —"
    cliff = "  ← the cliff" if prev and r / prev < 0.5 else ""
    print(f"{page:>4}  {r:>4}/{n:<2}  {kept:>5}  {avg:>9}{cliff}")
    prev = r
Run against the benchmark report's ten sessions:
$ DOC_ID=8432e-b4ebb-74433 API_TOKEN=... python3 dropoff.py
10 sessions · 8 pages

page  reached   kept  avg dwell
   1    10/10   100%        36s
   2    10/10   100%        33s
   3    10/10   100%        31s
   4     9/10    90%        30s
   5     8/10    89%        44s
   6     3/10    38%        33s  ← the cliff
   7     2/10    67%        30s
8 1/10 50% 29sFix the page, not the paper
Now the 66% average has an address. Reading the funnel:
- Page 5 works — highest dwell in the document (44s average). The case study holds attention; don't touch it.
- Page 6 is the cliff — five of eight remaining readers quit on the methodology spread. Move it to an appendix and let the recommendations follow the case study directly.
- Pages 7–8 are hostages — they're probably fine; almost nobody survived page 6 to judge them.
Ship the reordered version, send the next batch of links, re-run the script — the funnel is your before/after measurement. That loop is the same signal thinking that times your follow-ups.
Where to go from here
Per-page data answers more questions than “where do they quit?”
Related tutorials
How to See Who Viewed Your PDF — and What They Actually Read
Send one PDF to several people through personal tracking links, then see who opened it, how long they spent on each page, and who never showed up. First in the dashboard, then as a ranked per-recipient report built with a dependency-free Python script over the analytics API.
Freelancers: A Proposal Workflow Without Per-Seat Tools
Proposal software is priced for sales teams; freelancers just need the signal. A one-person workflow on the free plan: links per contact reveal the 12-minute open, the internal forward, and the 21:21 return visit that camped on the price page — plus the three-slot pipeline trick and honest edges.
Track Who Read the Documents They Were Required to Read
When the auditor asks who read the safety policy, 'we emailed it' is a shrug. Per-person links measure the reading, an in-document acknowledgement checkbox collects the signature, and one script joins them into a defensible roster: read 100% and acknowledged, read but unsigned, never opened.