
How to Build a PDF Engagement Dashboard for Your App
The Apdf dashboard answers Apdf's questions. Your product has its own: engagement next to deal stages, reading stats inside your client portal, a wall monitor for the sales floor. For that you don't need our UI — you need the data under it, and that's what the analytics API hands you.
This build is the smallest real version: one Node.js script, three endpoints, and a self-contained HTML dashboard that leads with wherever the reading is happening.
Know the three endpoints
Everything the dashboard shows comes from three GETs:
GET /api/docs                                   your documents
GET /api/docs/{docId}/analytics                 lifetime KPIs per document
GET /api/docs/{docId}/analytics/sessions        who read it, session by session
The KPI payload is dashboard-shaped already:
{
    "data": {
        "sessions": 10,
        "unique_viewers": 10,
        "avg_duration_ms": 180638,
        "completion_rate": 66,
        "pages_per_session": 5.3,
        "prints": 0,
        "downloads": 0,
        "form_submissions": 0,
        "annotations": 0
    }
}The generator — one file, no dependencies
It sweeps the workspace, sorts documents by activity (a dashboard should lead
with where the reading is), and writes a self-contained
dashboard.html:
import fs from 'node:fs';

const BASE = process.env.BASE ?? 'https://apdf.io';
const TOKEN = process.env.API_TOKEN;
const sleep = ms => new Promise(r => setTimeout(r, ms));

async function get(path) {
    const res = await fetch(`${BASE}/api${path}`, {
        headers: { 'Authorization': `Bearer ${TOKEN}`, 'Accept': 'application/json' },
    });
    if (!res.ok) throw new Error(`${path}: HTTP ${res.status}`);
    return res.json();
}

const docs = (await get('/docs?per_page=25')).data;
const cards = [];

const enriched = [];
for (const doc of docs) {
    await sleep(500); // stay under the API's burst rate limit
    const kpis = (await get(`/docs/${doc.doc_id}/analytics`)).data;
    enriched.push({ doc, kpis });
}

// most-read documents first — a dashboard should lead with where the activity is
enriched.sort((a, b) => b.kpis.sessions - a.kpis.sessions);

for (const { doc, kpis } of enriched.slice(0, 6)) {
    await sleep(500);
    const sessions = (await get(`/docs/${doc.doc_id}/analytics/sessions?per_page=5`)).data;

    const rows = sessions.map(s => `
        <tr>
            <td>${s.recipient?.name ?? 'Anonymous'}</td>
            <td>${s.completion_pct}%</td>
            <td>${Math.round(s.total_duration_ms / 1000)}s</td>
            <td><div class="bar"><span style="width:${s.completion_pct}%"></span></div></td>
        </tr>`).join('');

    cards.push(`
    <section class="card">
        <h2>${doc.name}</h2>
        <div class="kpis">
            <div><b>${kpis.sessions}</b><span>sessions</span></div>
            <div><b>${kpis.unique_viewers}</b><span>viewers</span></div>
            <div><b>${Math.round(kpis.avg_duration_ms / 1000)}s</b><span>avg read</span></div>
            <div><b>${kpis.completion_rate}%</b><span>completion</span></div>
        </div>
        ${sessions.length ? `<table><thead><tr><th>Reader</th><th>Done</th><th>Time</th><th></th></tr></thead><tbody>${rows}</tbody></table>` : '<p class="quiet">No sessions yet</p>'}
    </section>`);
}

fs.writeFileSync('dashboard.html', `<!doctype html>...${cards.join('')}...`);
console.log(`dashboard.html written — top ${cards.length} of ${docs.length} documents`);
(The HTML template with its styles is boilerplate — dark cards, KPI row, completion bars — and entirely yours to restyle; the screenshot below shows the version this tutorial ships.)
Render, then make it live
$ API_TOKEN=... node dashboard.mjs
dashboard.html written — top 6 of 20 documents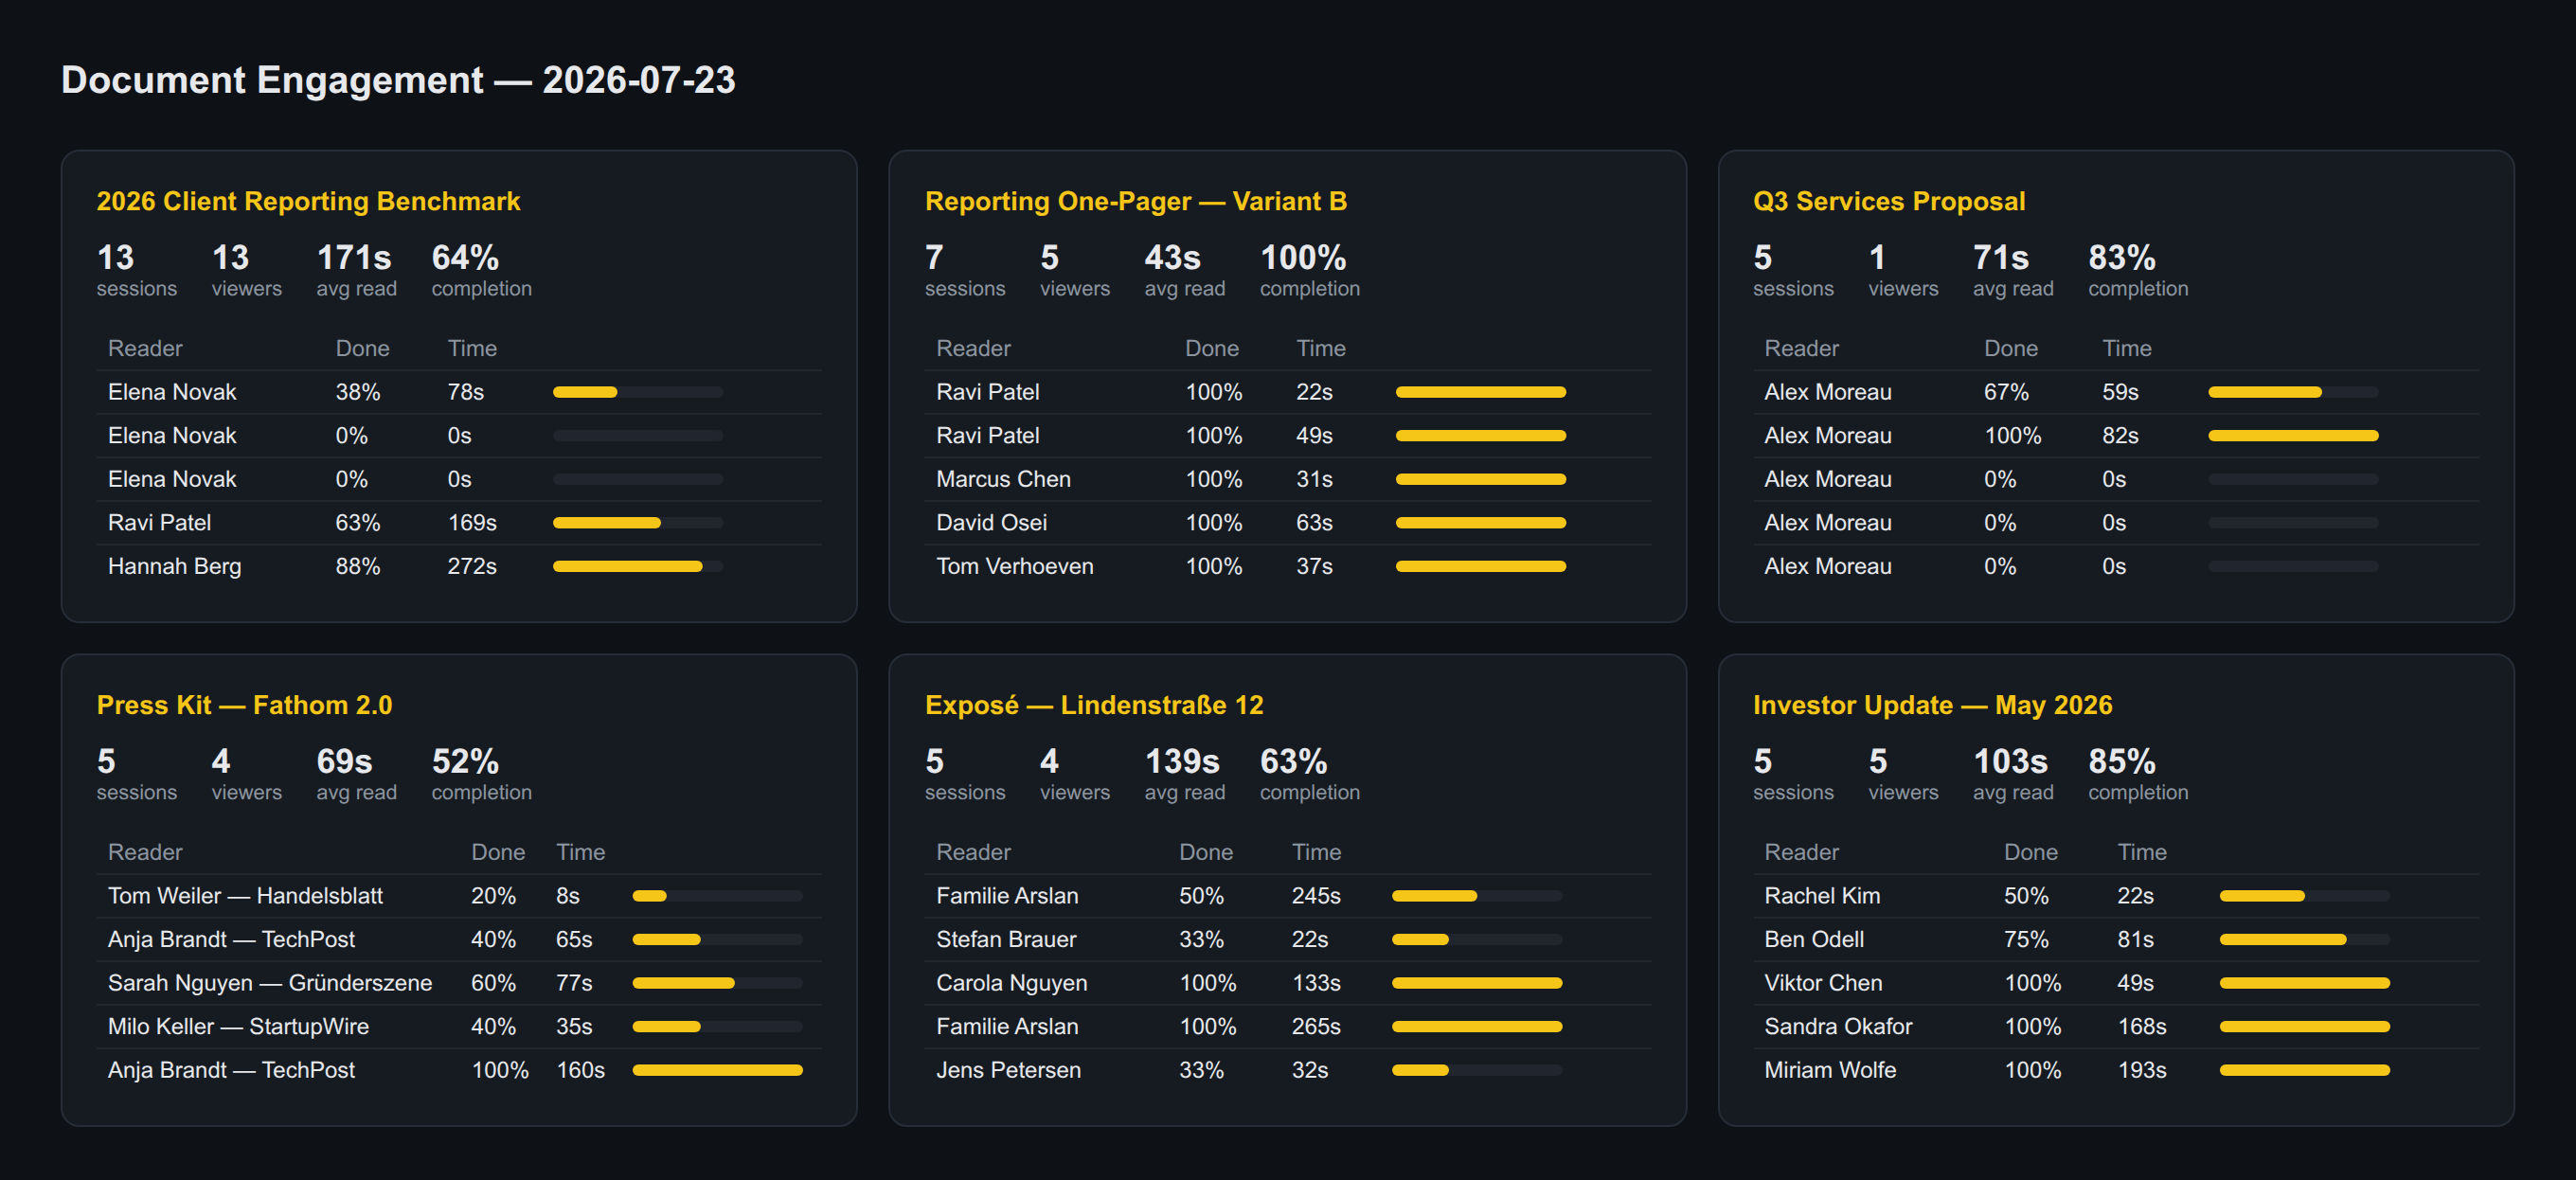
From here it's your product: run the script on a cron and serve the file to a wall monitor, or move the same three fetches into your backend and render the cards inside your app.
Where to go from here
Three directions to grow the build.
Related tutorials
Build a Morning Briefing Agent for Your Documents
A digest lists what happened; a briefing arrives with the thinking done. One standing prompt over the MCP-connected workspace and Claude sweeps every document's sessions on a headless cron — call-first with evidence and a suggested opener, the next tier in one line each, and the silence flagged.
See If Clients Actually Read Your Monthly Reports
The report nobody reads is the retainer nobody renews. Tracked links per client sort the portfolio in one sweep — both Meridian stakeholders read cover to cover, Brightpath flicked for 15 seconds, Okafor never opened — and per-page data tells you whether your decision request was ever seen.
Review the Whole Reading History Before the Sales Call
The sharpest pre-call artifact isn't in the CRM — it's how the prospect read your proposal this week. Pull every session in one call, zoom into the two visits that matter, and write the three-line brief: full read at 07:17, back twenty minutes later for the pricing page. Today's call is the number.